Single-cell sequencing has changed markedly since its first publication in 20091. In that seminal study, researchers manually picked single cells under a microscope, prepared an RNA-Seq library from each cell in the well of a standard microplate, and performed next generation sequencing (NGS) on the now-obsolete ABI® SOLiD™ platform. Today, hundreds to thousands of cells from a sample can be partitioned, prepared, and multiplexed on an Illumina® sequencer in a highly automated manner. Here, we’ll explore the nuts and bolts of single-cell sequencing, focusing on current high-throughput technologies, and discuss how it’s been adapted for several applications.
The Basics of Single-Cell Sequencing
Compared to bulk strategies, single-cell methods add complexity to steps upstream and downstream of the sequencing reaction. Prior to sequencing, cells are isolated into individual compartments for construction of barcoded libraries. After sequencing, the data is parsed according to the cell-specific barcodes and analyzed.
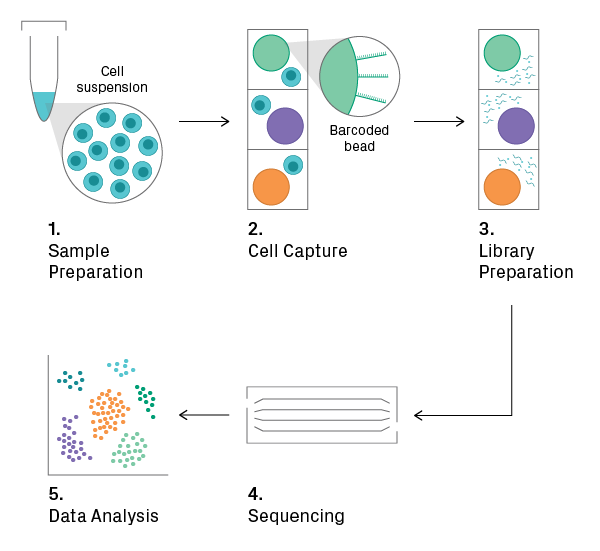
Let’s go through the basic steps of single-cell sequencing. In the next section, we’ll highlight some of the differences between commercial platforms.

1. Sample Preparation
The input for the overall workflow is a suspension of single cells. If analyzing tissue, dissociation is necessary, which can be tricky for tissues with an extracellular matrix. Depending on the application, isolated nuclei may be used as an alternative. Cell viability should be measured before proceeding to the next step, as a high percentage of intact and live cells is required for obtaining good data.
2. Cell Capture
The cell suspension is loaded onto a microfluidic chip or cartridge, where cells are partitioned into nanoliter-scale chambers, such as droplets or wells. The technology for cell capture differs between commercial platforms, but each employs its own set of measures to deter and/or detect loading of more than one cell per chamber (see Single-Cell Platforms section). During or shortly after cell capture, a unique oligonucleotide sequence (i.e., barcode) is added to each chamber, allowing for downstream identification of the cell. This can be accomplished with oligo-tagged beads, for example.
3. Library Preparation
Cells are lysed, and library construction begins. The enzymatic reactions that follow depend on the application (see Single-Cell Techniques section). Within the microchamber, the cell-specific barcode is added to the target sequences; thus, all fragments from the same cell will share a common identifier. The barcoded fragments from all microchambers are then pooled, and the final steps of library construction (i.e., amplification and adding a sample index) are performed.
4. Sequencing
The pooled library is sequenced on the Illumina platform.
5. Data Analysis
Raw sequencing data undergoes pre-processing. Reads of low quality and those unlikely to have originated from a viable cell are thrown out. For example, reads containing a barcode with a low count and few detected genes probably represent background noise. After quality control, the data is normalized across cellular barcodes. The number of useful reads varies greatly between cells, mainly due to the low depth of sequencing per cell (i.e., sampling effects). The data is then subjected to downstream analysis, which includes feature selection, dimensionality reduction, and/or visualization2. The goal here is to find biologically meaningful patterns, such as clusters in t-SNE plots that represent distinct cell types.
Single-Cell Platforms
Several commercial platforms are available for single-cell sequencing. They share the principles outlined above but primarily use different approaches for cell capture. The most popular platform is the 10x Genomics® Chromium™, providing high-throughput and a broad array of applications3.
Comparison of Single-Cell Platforms
| Platform | Technology for Cell Capture | Maximum Throughput (Cells per chip/cartridge) |
|---|---|---|
| 10x Genomics Chromium | Droplet encapsulation | 80,000 (10,000 per lane) |
| BD® Rhapsody™ | Nanowells | 20,000 |
| Takara Bio® ICELL8™ | Nanowells | 1,800 |
| Illumina/Bio-Rad® ddSEQ™ | Droplet encapsulation | 1,200 |
| Fluidigm® C1™ | Nanochannels | 800 |
Droplet Encapsulation
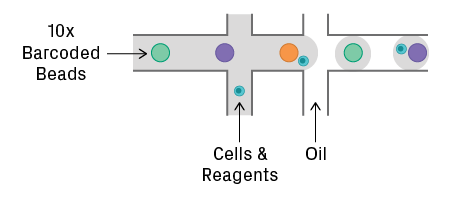
The 10x Genomics Chromium and Illumina/Bio-Rad ddSEQ use an emulsion of water-in-oil droplets. Cells, reagents, and barcodes are co-encapsulated into a droplet. The Chromium system uses gel beads coated with a unique oligo sequence, known as a 10x barcode (see figure below). Beads and cells are introduced at low concentration to reduce the chance of forming doublets.

Nanowells
BD Rhapsody and Takara Bio ICELL8 use a chip or cartridge with an array of microscopic wells. Cells are dispensed onto the chip, capturing cells in the wells. For the Rhapsody system, a low concentration of cells ensures that few wells will contain more than one cell. Oligo-tagged beads containing the barcodes are then added to the wells, which are designed to accommodate one bead each4. The ICELL8 platform uses an imaging system to determine the number of cells in each well. Coupled with nanowell-specific barcodes printed on the chip, the system can track the wells containing one cell and analyze data exclusively from these.
Nanochannels
The Fluidigm C1 uses a fluidics circuit to trap cells into individual chambers. The physical dimensions of the nanochannel ensure that a single cell (of a well-defined size) is captured. Imaging can be performed to confirm cell count, viability, or phenotype. Reagents and cell-specific barcodes are then delivered to each chamber via microfluidics.
Single-Cell Techniques
Uncovering heterogeneity in a sample, single-cell sequencing enables analysis of transcriptomes, epigenomes, and immune repertoires at the resolution of individual cells. Below is a comparison of single-cell sequencing techniques, each designed for a particular application. They differ primarily in how the NGS libraries are constructed and how the sequencing data is analyzed. For simplicity, we’ll focus our discussion on the 10x Genomics Chromium platform.
Comparison of Single-Cell Techniques
| Single-Cell RNA-Seq | Single-Cell ATAC-Seq | Single-Cell Multiomics (RNA + ATAC) | Single-Cell Immuno-Profiling | |
|---|---|---|---|---|
| Analyzes | Gene expression (transcriptome) | Regions of open chromatin (epigenome) | Transcriptome + Epigenome | B-cell or T-cell receptor (BCR/TCR) repertoires |
| Target Sequence | Polyadenylated mRNA | Transposase-accessible chromatin | Polyadenylated mRNA & transposase-accessible chromatin | V(D)J sequences of BCR or TCR mRNA |
| Sample Input | Cell or nuclei suspension | Nuclei suspension | Nuclei suspension | Cell suspension |
Single-Cell RNA Sequencing (scRNA-Seq)
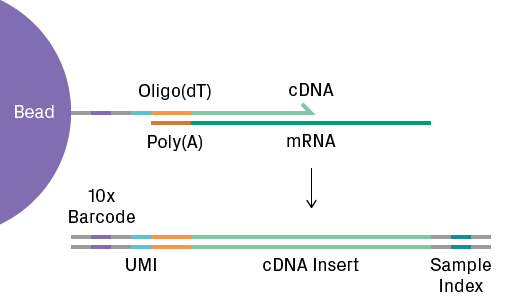
ScRNA-Seq analyzes gene expression and more broadly the transcriptome. It’s the most popular single-cell technique. During library preparation, oligo(dT) tags on the gel beads capture polyadenylated mRNA molecules. Reverse transcription generates cDNA labeled with a cell-specific 10x barcode and a unique molecular identifier (UMI) to label the transcript (see figure below). The cDNA libraries are subsequently sequenced. The data generated from scRNA-Seq is massive and complex, requiring sophisticated statistical and computational methods5. Key to data analysis is the expression matrix, which represents the number of transcripts observed for each gene and cell. Bioinformatic software generates and analyzes these matrices to reveal clustering of similar transcriptional profiles.

Single-Cell ATAC Sequencing (scATAC-Seq)
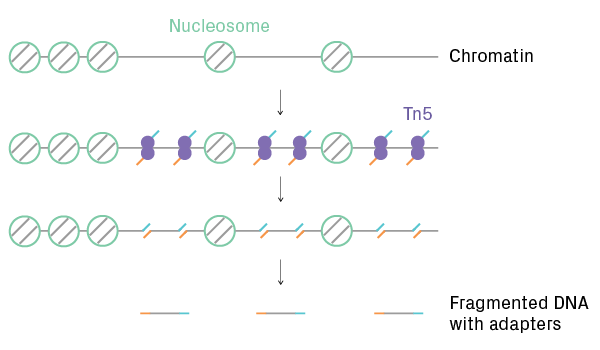
ScATAC-Seq identifies regions of open chromatin and efficiently labels them for NGS. It profiles chromatin accessibility, providing insights into genome-wide epigenetic regulation. After cell partitioning, Tn5 transposase simultaneously cleaves and adds adapters to nucleosome-free regions of DNA (see figure below). The transposed DNA fragments are then labeled with cellular barcodes. After sequencing, data analysis software generates open chromatin profiles for each cell and identifies clusters with similar call peak patterns.

Single-Cell Multiomics (RNA + ATAC)
Both the transcriptome and epigenome can be analyzed in the same cell. In this multiomic approach, isolated nuclei are partitioned, and the library preparation reactions for scRNA-Seq and scATAC-Seq occur simultaneously in the droplet. The cDNA and transposed DNA are labeled with the same cellular barcode. Linking transcriptional and epigenetic data enables researchers to measure how chromatin structure influences the regulation of gene expression. With a single-cell approach, this relationship can be elucidated even in highly heterogeneous tissues, such as a tumor.
Single-Cell Immuno-Profiling
Immuno-profiling, also called immune repertoire profiling, analyzes the V(D)J sequences of B-cell receptors (BCR) and T-cell receptors (TCR) at the RNA level. As with scRNA-Seq, library preparation begins with reverse transcription and barcode tagging. With a targeted approach, only V(D)J sequences are subsequently amplified using primers specific to either the BCR or TCR constant regions (see figure below). After target enrichment, the library is sequenced and the resulting data is analyzed to create immune repertoire profiles. With single-cell sequencing, the heavy (VH) and light (VL) chains in each BCR can be paired. The same goes for alpha and beta chains in each TCR. This information is potentially lost with bulk sequencing approaches. Single-cell immuno-profiling can be combined with standard scRNA-Seq for more comprehensive results, allowing characterization of cell types and cell states.

Key Takeaways
- Single-cell sequencing begins with a cell suspension, then cells are partitioned, one apiece, into microscopic compartments using a high-throughput technology
- A unique oligo barcode is added to all fragments originating from one cell during library preparation
- After libraries are pooled and sequenced, bioinformatic software can generate cell-specific profiles from the barcoded reads and cluster cells with similar characteristics
Conclusion
Single-cell sequencing is based on the principles of NGS, albeit more complicated than bulk sequencing. Advancements in cell capture, library construction chemistries, sequencing throughput, and data analysis have fueled the rapid growth of single-cell sequencing across many applications in biology and medicine.
Have a question about single-cell sequencing? Feel free to reach out to one of our technical experts. We’ll gladly discuss your project and help you figure out if single-cell sequencing is the best solution.
References
1. Tang, F. et al. mRNA-Seq whole-transcriptome analysis of a single cell. Nat. Methods 6, 377–382 (2009).
2. Luecken, M. D. & Theis, F. J. Current best practices in single‐cell RNA‐seq analysis: a tutorial. Mol Syst Biol 15, (2019).
3. Valihrach, L., Androvic, P. & Kubista, M. Platforms for Single-Cell Collection and Analysis. IJMS 19, 807 (2018).
4. Dove, A. Shotgunning the Messenger: Single-cell RNA sequencing. Science (2019).
5. Andrews, T. S., Kiselev, V. Y., McCarthy, D. & Hemberg, M. Tutorial: guidelines for the computational analysis of single-cell RNA sequencing data. Nat Protoc 16, 1–9 (2020).atient health. At Azenta Life Sciences, we will collaborate with you to realize efficiencies by maximizing the value of your sample assets. Contact us today to learn how.


